Summary/Abstract
We investigate trends in death rates from musculoskeletal diseases (ICD-10 codes M00-M99) for all age groups in the US using data from the CDC (Centers for Disease Control and Prevention). We also perform a detailed analysis for older individuals aged 75 to 84. We analyse trends in musculoskeletal diseases where these appear on the death certificate under multiple causes (MC) of death, or as the underlying cause (UC), as well as the trends in the ratio of multiple cause to underlying cause death rates.
For individuals aged 75 to 84 our results show that the excess UC death rates from musculoskeletal diseases (M00-M99) diseases for individuals aged 75 to 84 were 4.7% (Z-Score of 1.7) in 2020, then rose to 15.2% (Z-Score of 5.6) in 2021, 16.6% (Z-Score of 6.1) in 2022 and 26.6% (Z-Score of 9.8) in 2023. Excess death rates rose in each consecutive year from 2020 to 2023, and from 2021 onwards, statistical significance of excess deaths can be considered extreme occurrences. We also observe that the rises of MC* musculoskeletal excess death rates (deaths involving musculoskeletal diseases as either an underlying or contributory cause but where COVID-19-related deaths are excluded) in 2020, 2021, 2022 and 2023 mirror the excess UC death rates, suggests that a common underlying factor is at play.
When analysing the most common causes of death for older individuals aged 75-84, within the musculoskeletal system, namely arthropathies (icd10 codes: M00-M25) and osteopathies and chondropathies (icd10 codes: M80-M94) we find similar patterns of behaviour.
Trends in Death Rates from Musculoskeletal Diseases (ICD-10 codes: M00-M99) for Ages 75-84
In this section we analyse the trend in yearly death rates from musculoskeletal diseases for individuals aged 75 to 84 in the USA. We use the 2013-2019 trend in deaths per 100,000 (death rates) as the baseline estimate for excess death rates. Excess death rates for the 2013-2019 period are in-sample while the rates for 2020, 2021, 2022 and 2023 are out of sample computations.
Trends in MC (Multiple-Causes) and UC (Underlying-Cause) Death Rates from Musculoskeletal Diseases
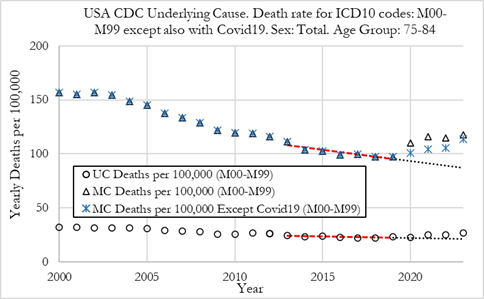
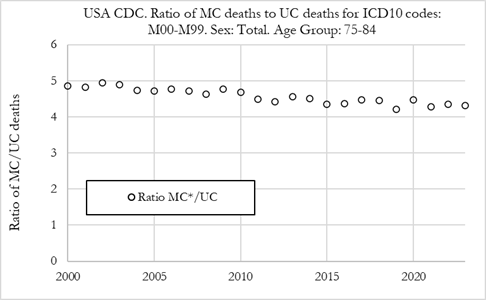
The Figure (left) below shows the death rate per 100,000 individuals from musculoskeletal diseases (ICD-10 codes M00-M99) in the US, for the 75-84 age group of both sexes. The Figure plots death rates as underlying cause of death (UC) and reported as multiple-cause (MC) of death, as well as MC* death rates (where COVID-19-related deaths are removed from MC death counts). The Figure on the right shows the ratio of MC deahts by UC deaths.
Summary:
The figure (left) shows the death rate per 100,000 individuals for deaths from musculoskeletal diseases in the US from 2000 to 2023. We can observe that both UC and MC death rates with musculoskeletal diseases in the 75-84 age group have been trending lower from 2000 to 2019.
-
For MC death rates, in 2000 the death rate was 156.8 per 100,000 and in 2019 it was 97.4 per 100,000, a 37.9% decline (which corresponds to a 1.89% drop per annum).
-
For UC death rates, in 2000 the death rate was 32.2 per 100,000 and in 2019 it was 23.1 per 100,000, a 28.3% decline (which corresponds to a 1.41% drop per annum).
-
We also observe in the figure (right) that the ratio of MC to UC deaths also declined steadily from 2000 to 2019, from a value of about 4.9 in 2000 to about 4.1 in 2019. It should be noted that MC and MC* (except COVID-19) death rates were the same from 2000 to 2019 as COVID-19 deaths only started in 2020.
From 2020, the results show:
-
The MC death rate rose in 2020 to 110.4 per 100,000, and then rose again to 116.0 per 100,000 in 2021. In 2022 the MC death rate dropped slightly to 114.8 per 100,000 and in 2023 it rose again to 117.8 per 100,000.
-
After removing COVID-19-related deaths, we see that the MC* death rate rose in 2020 to 101.4 per 100,000, and then rose again to 104.4 per 100,000 in 2021, to 105.4 per 100,000 in 2022 and in 2023 it rose again to 113.4 per 100,000. Even after removing COVID-19 related deaths, we observe an increase in MC* musculoskeletal deaths in 2020, 2021, 2022, and 2023.
-
The UC death rate dropped in 2020 to 22.9 per 100,000, and then rose to 24.9 per 100,000 in 2021. In 2022 the UC death rate was again 24.9 per 100,000 and in 2023 it rose further to 26.7 per 100,000.
-
The ratio of MC* to UC deaths remained stable in 2021, 2022 and 2023, after a slight rise in 2020.
Excess Death Rates from Musculoskeletal Diseases for Ages 75-84, Both Sexes.
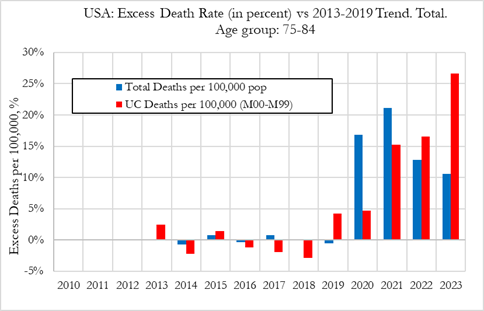
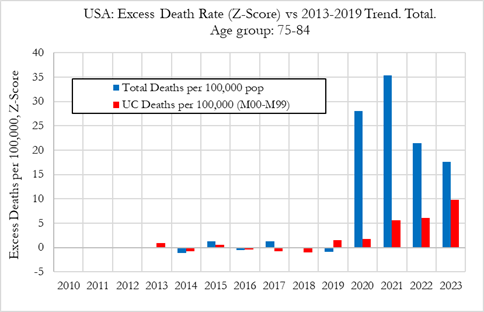
In this section we investigate excess death rates from musculoskeletal diseases in the US, for the 75 to 84 age group from 2010 to 2023. The figure on the left refers to relative deviations from the 2010-2019 trend, while the figure on the right shows the Z-score (signal strength) for the deviations from trend.
Excess UC Death Rates from Musculoskeletal Diseases, 75-84
The results show significant rises in excess UC death rates from/with musculoskeletal diseases in 2021 to 2023, for individuals aged 75 to 84 in the US.
Summary:
-
In the left figure we can observe that the excess death rates from musculoskeletal diseases as the underlying cause (UC) were 4.7% (Z-Score of 1.7) in 2020, then rose to 15.2% (Z-Score of 5.6) in 2021, 16.6% (Z-Score of 6.1) in 2022 and 26.6% (Z-Score of 9.8) in 2023.
-
By comparison, the excess mortality for all-cause deaths was 16.8% in 2020, 21.1% in 2021, 12.8% in 2022, and 10.5% in 2023.
-
It is noteworthy that while excess all-cause mortality peaked in 2021 and then dropped in 2022 and 2023, excess deaths from musculoskeletal diseases as the underlying cause rose consecutively in 2021, 2022 and 2023. Additionally, while excess all-cause deaths suffered an extreme rise of 16.8% (28 standard deviation rise) in 2020, excess musculoskeletal death rates were subdued at about 4.7% (Z-score of 1.7), showing low statistical significance.
Excess MC Death Rates from Musculoskeletal Diseases, ages 75-84
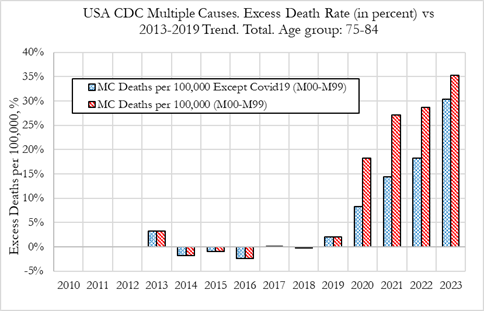
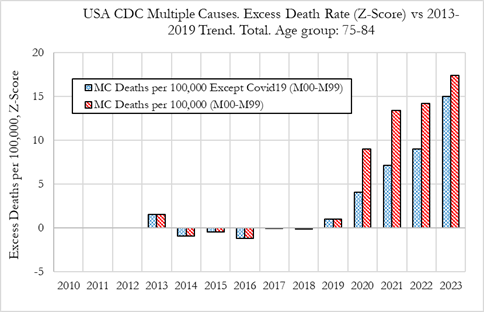
The results show significant rises in excess MC and MC* death rates with musculoskeletal diseases in 2021 to 2023, for individuals aged 75 to 84 in the US.
Observations:
-
In left figure we can observe that the excess MC death rates from musculoskeletal diseases were 18.3% (Z-Score of 9.0) in 2020, then rose to 27.2% (Z-Score of 13.4) in 2021, and to 28.8% (Z-Score of 14.2) in 2022, and 35.3% (Z-Score of 17.4) in 2023. In terms of the statistical significance of the excess deaths, these can be considered extreme events.
-
By comparison, the excess MC* death rates from musculoskeletal diseases where COVID-19-related deaths were removed, were 8.3% (Z-Score of 4.1) in 2020, 14.5% (Z-Score of 7.1) in 2021, 18.2% (Z-Score of 9.0) in 2022 and 30.3% (Z-Score of 15.0) in 2023. Of note is that the rise in excess mortality for MC deaths from musculoskeletal diseases where COVID-19-related deaths were removed, exhibited a similar pattern to UC excess death rates from musculoskeletal diseases (shown in the Figure in the previous section).
-
We also observe that MC* death rates are substantially higher than UC death rates from musculoskeletal diseases, as illustrated by the ratio of MC*/UC death rates which is ranges between 4 to 5 across the 2010-2023 period. The ratio did not vary significantly during the pandemic years, 2020, 2021, 2022 and 2023, indicating that both MC* and UC death rates from musculoskeletal diseases had similar behaviours during those years.
Excess Death Rates from Musculoskeletal Diseases for All age groups
In this section we investigate excess death rates from/with Musculoskeletal Diseases in the US, for all 10y age groups.
Excess Death Rates from Musculoskeletal Diseases for all ages, both sexes
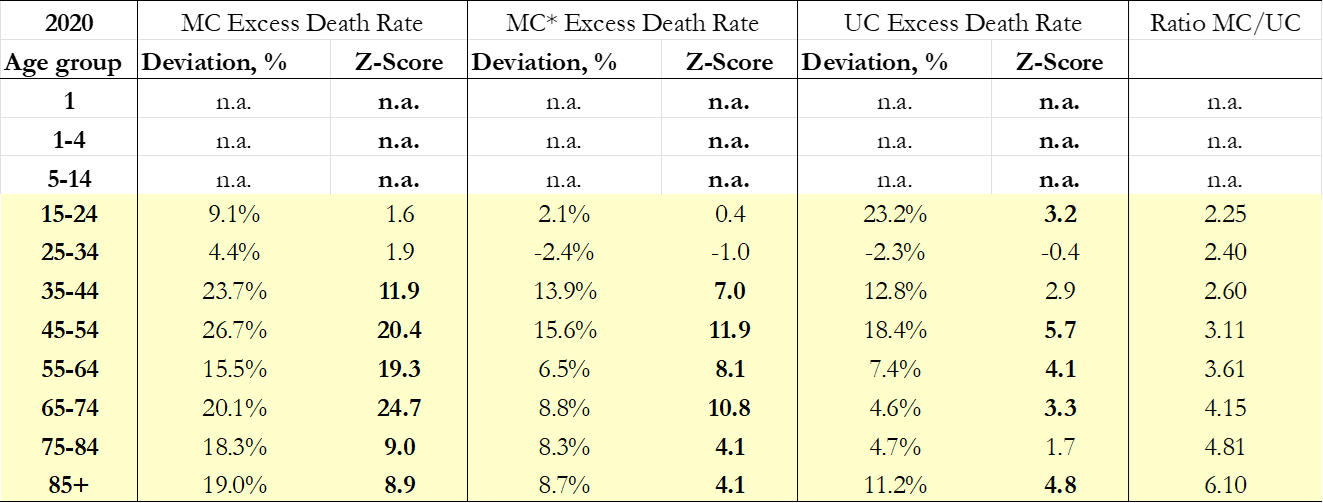
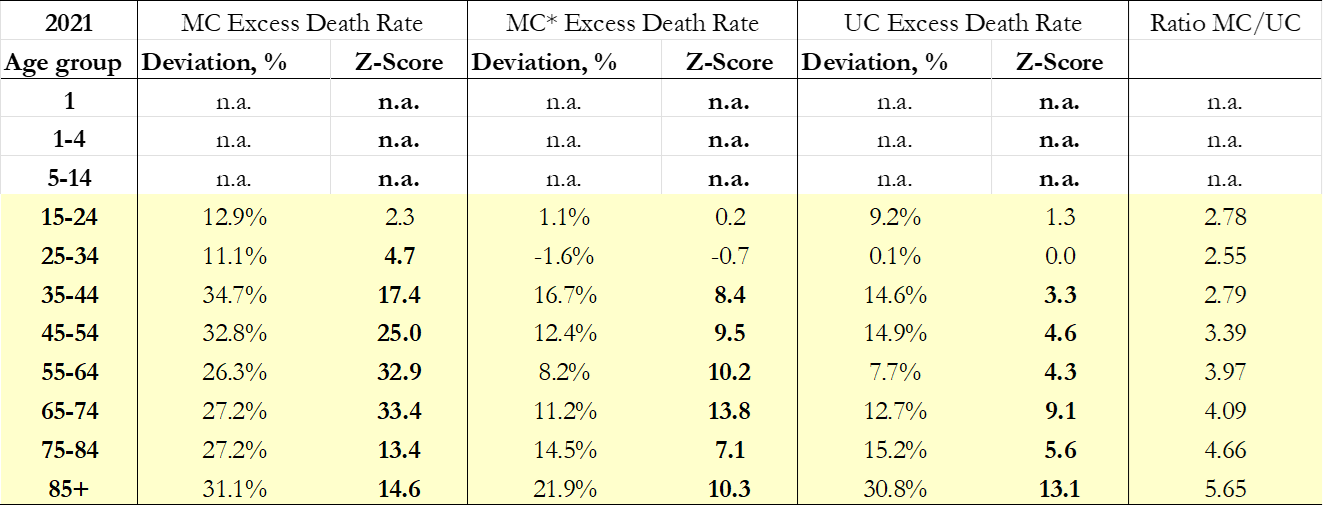
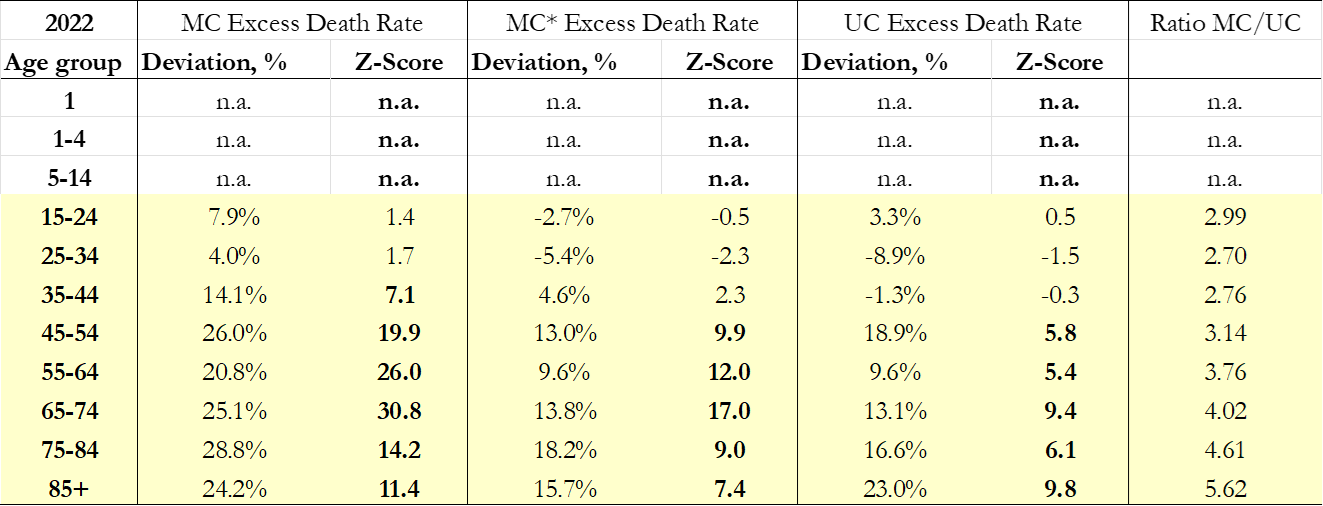
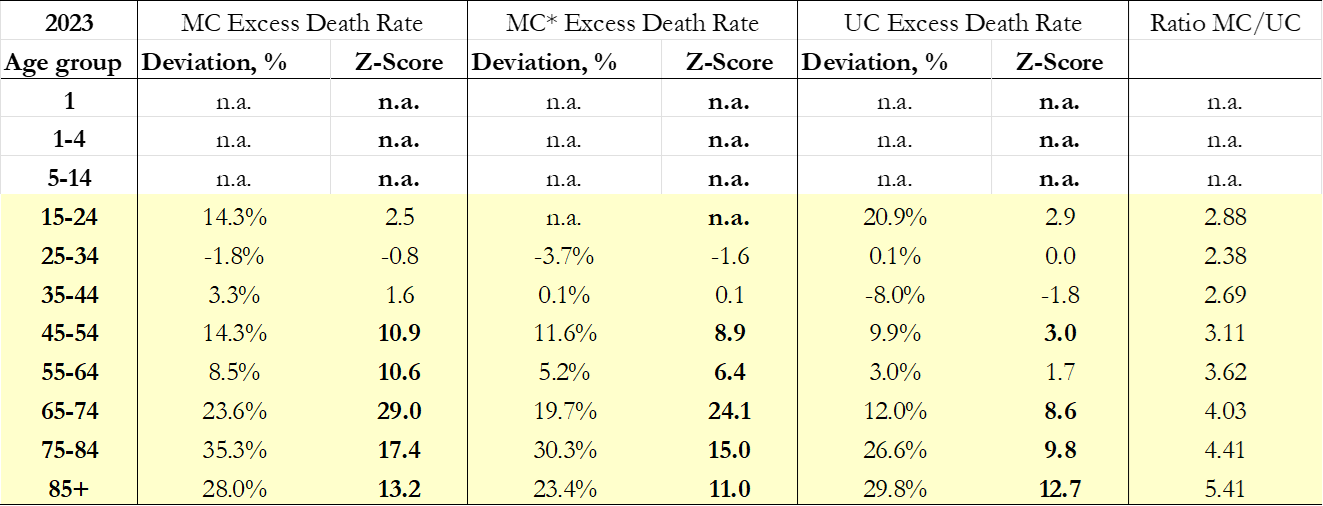
The excess death rates refer to deviations from the 2013-2019 trend. We show the excess deaths and death rates for MC, MC* (Except Covid-19) and UC deaths from musculoskeletal diseases. The tables show relative deviations from the 2013-2019 trend, the respective Z-scores (signal strength).
The results for age groups 1, 1-4, 5-14 and 15-24 are not reliable due to small sample sizes and suppressed data from the CDC.
Conclusions
-
We observe statistically significant excess UC death rates from musculoskeletal diseases for age groups 35-44, 45-54 and 55-64, particularly in 2020 and 2021. For the younger age group 35-44 excess death rates dropped substantially to “normal” values in 2022 and 2023, while for age groups 45-54 and 55-64 the excess death rates were high in 2022 and only dropped in 2023. Our results are corroborated by the analysis of MC* death rates (where COVID-19-related deaths are excluded) from musculoskeletal diseases, which shows a similar pattern of to UC excess mortality.
-
As example, within these age groups, as shown in Figure 13, the largest percentage of excess UC deaths were observed in the 45-54 age group, where excess UC death rates were 18.4% (Z-score: 5.7) in 2020, 14.6% (Z-Score: 3.3) in 2021, 18.9% (Z-Score: 5.8) in 2022 and 9.9% (Z-Score: 3.0) in 2023. By comparison, excess MC* deaths rates were 15.6% (Z-score: 11.9) in 2020, 12.4% (Z-Score: 9.5) in 2021, 13.0% (Z-Score: 9.9) in 2022 and 11.6% (Z-Score: 8.9) in 2023.
-
Our results indicate that for younger individuals, excess death rates from musculoskeletal diseases appear to be closely related with all-cause mortality during the Covid-19 pandemic. The factors that are driving the excess death rates could be either the societal lockdowns (in 2020), sequalae from the COVID-19 disease (in 2020 through 2023), or COVID-19 vaccinations from 2021 onwards
(Alessandria et. al.). We cannot exclude other possible contributing factors such as pandemic-related changes in lifestyles or other factors. It should be mentioned that as musculoskeletal deaths tend to be classified as a contributing cause instead of underlying cause of death, acute COVID-19-associated deaths are an unlikely explanation to the observed excess mortality. Furthermore, the relatively low excess deaths from UC for younger individuals might be a consequence of a pull forward effect resulting from excess mortality in these age groups (which is evidenced by a rise in MC excess death rate).
-
For older age groups 65-74, 75-84 and 85+ we observe statistically significant excess UC death rates, that increased consecutively from 2020 to 2023. The signal strengths in 2020 were weaker than for younger individuals as illustrated by the 4.7% excess death rate for individuals aged 75 to 84 with a 1.7 Z-Score. For the same age group, UC excess death rates increased to 15.2% (Z-score of 5.6) in 2021, 16.6% (Z-score of 6.1) in 2022 and 26.6% (Z-Score of 9.8) in 2023, as shown in the tables above.
-
The results suggest that there are different patterns for older individuals when compared to younger individuals. For older individuals the pattern of excess mortality from musculoskeletal diseases is different, as for these individuals, excess deaths continued to rise in 2022 and 2023, indicating a worsening of the underlying phenomenon. Additionally, one must also consider the “dry tinder” effect where fragile individuals who suffer from chronic conditions were deceased earlier than expected. If this was the case, one would expect to observe low or negative excess death rates in 2022 and 2023, which is not the case.
-
As for possible causes for this phenomenon, a larger body of evidence is pointing towards the continuous uptake of COVID-19 inoculations within the older age groups being a factor that is driving the phenomenon, as for example, from evidence of side effects from the vaccines is shown by
Fraiman et. al., and in particular for inflammatory musculoskeletal diseases in shown in
Park et. al.. Furthermore, the recent paper by Alessandria et al. points to higher all-cause mortality COVID-19 vaccinated individuals when compared to unvaccinated ones
(Alessandria et. al.).
-
One cannot exclude other possible contributing factors such as pandemic-related changes in lifestyles, inflammatory processes due to cumulative exposures to SARS-CoV-2, “Long COVID”
(Jangnin, et. al.), or other factors. It should be mentioned that as musculoskeletal deaths tend to be classified as a contributing cause instead of underlying cause of death, acute COVID-19-associated deaths are an unlikely explanation to the observed excess mortality.
To read the full analysis, the link to pre-print paper is below.
Paper Link
